Political media dollars exploded in the 2019-2020 cycle, and House races contributed to more than $8B in total spending. Spending across all general elections in the battle for the House of Representatives this year reached $990M. We saw $118M of this total spend concentrated among 5 very competitive races: NY CD-11, NY CD-22, NM CD-02, FL CD-26 and TX CD-24.
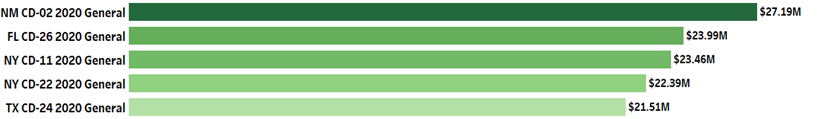
The most expensive of these contests was NM CD-02 with slightly more than $27M spent. For reference, in an equally competitive general election in 2018 in this district, only $9M was spent. This amount of spending also makes the NM CD-02 race the most expensive House race ever, not including races with a runoff. The drastic increase in spending in the Albuquerque and El Paso media markets was unexpected in comparison to larger metropolitan areas where other high spend Congressional districts reside such as Dallas, Miami, and New York City.
Four of these five Congressional races featured a freshmen Democratic incumbent. TX CD-24 was an open seat, previously held by the Republicans. Ultimately, the Republican candidate won each of these races, except for NY CD-22, where no clear winner is determined more than 2 months after election day.
How Political Media Dollars Translated to Votes
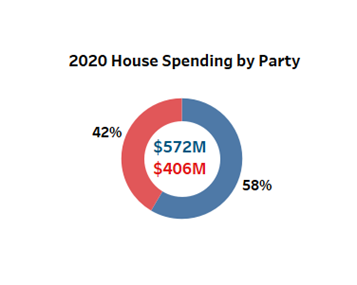
Surprisingly, Democrats outspent Republicans 58% to 42% in an unsuccessful bid to gain ground in the House. Democrats spent $70M in an attempt to defend four seats and gain one. Republicans spent only $48M to protect one seat and gain four. This falls in line with the trend of other Congressional races across the country.
 In the 376 Congressional races that we have spending data recorded for, Democrats outspent Republicans by almost 20%. To date, Republicans have picked up 11 seats in the House while spending nearly $166M less than their Democratic peers.
NY-CD 11, NY-CD 22, NM-CD 02, and FL-CD 26 were all seats held by Republicans that Democrats flipped in 2018 to gain majority in the House. This cycle, TX CD-24 became an open seat when former Representative Kenny Marchant retired after holding that seat since 2004. Democrats targeted this Dallas-based district, as all the other surrounding districts are held by Democrats. They had to spend far more attempting to hold onto these vulnerable seats than they spent capturing them in 2018. This is partially because some districts previously showed high level of support for President Trump. He won NM-CD 02, NY CD-11, and NY CD-22, by over 10 points in 2016.
NY CD-11 saw the largest discrepancies in spending out of these five races, where spending in favor of Democratic incumbent Max Rose reached $16M, accounting for 68% of spending in that race. Republicans only spent $7.5M. This race also accounted for one of the largest vote margins, where Republican challenger, Nicole Ziccarelli received 53% of the vote to Rose’s 46%. In NY CD-22 spending by both parties was relatively even, translating to an almost exact even split of the vote. As of December 14th, only 12 votes separate Representative Anthony Brindisi and his Republican Challenger Claudia Tenney.  *Percent of vote from New York Times election results.
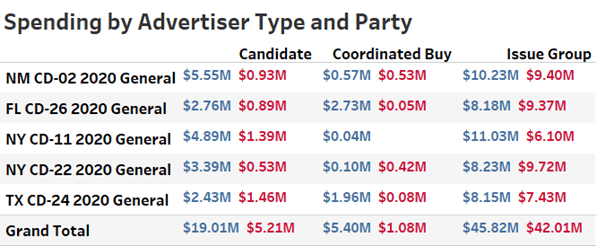
Difference in Advertiser Type
Breaking down these races by advertiser type, most of Republican spending was concentrated amongst issue groups and campaign committees. Only two advertisers, Congressional Leadership Fund and the NRCC account for $40M of the $48M spent on these races. Comparatively on the Democratic side, DCCC and House Majority Pac spent almost as much as their Republican counterparts with $35M. This left room for other affiliated issue groups and candidates to make up the rest of the total $70M spent. Democratic candidates outspent their Republican opponents by almost $15M. Democratic candidates accounted for 80% of all candidate spending across these 5 races, showing how highly active Republican groups were.
These 5 races are within the top 7 races with highest spend on advertising, with only the GA CD-06 2017 Special General election placing in 2nd with $26M spent, and the PA CD-01 2018 General election placing 5th with $22.8M spent.
For more information about AdImpact’s database of political media dollars, visit our solutions page or contact us!