Written by Nate Schwartz and Ethan Mort
In the world of political advertising, the total amount of money an advertiser spends will not always fetch the same ad rates across the country. For instance, the New York City media market is more expensive than the Juneau market, and candidates have cheaper ad buying rates than issue groups. Because of this, the cost per vote (CPV) can differ wildly based on a variety of factors. CPV is comparing the amount of ad money spent to the number of votes received in respective elections.
While political ad spending cannot directly be tied to election performance, this FiveThirtyEight article from 2018 discusses how the higher spending candidate often ends up winning. This is a correlation rather than a causation, as there are many other confounding variables that go into how an election is decided. However, spending a lot of money can be seen as an opportunity in an election; toss-up elections consistently see more money in them than elections that are somewhat safely decided before election day. Additionally, issue groups reserve airtime in elections they deem important to supplement a candidate’s spending.
Senate Cost Per Vote
Senate elections had the highest CPV in the 2022 cycle, beating House and gubernatorial elections. Given that Senate elections saw the most spending between these categories and the fewest number of votes, they were the most expensive in terms of CPV.
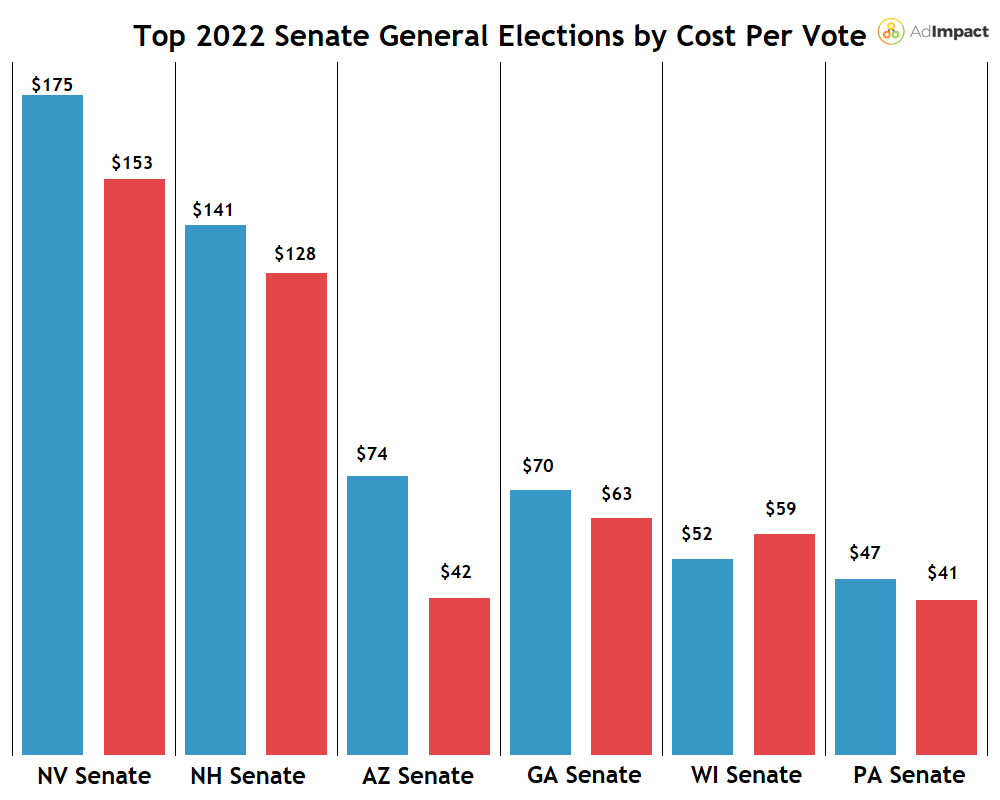
The most expensive Senate election by CPV was Nevada’s general election. Both Democratic and Republican advertisers’ CPV was greater than $150. The Senate election with the second highest CPV was New Hampshire’s general election, with a $141 CPV for Democratic advertisers and a $128 CPV for GOP advertisers.
By CPV, the least expensive tossup election was PA Senate general, with a $47 Democratic CPV and a $41 Republican CPV. It was the second most expensive Senate general election in 2022, with $230M spent, only trailing the GA Senate general election ($257M before the runoff).
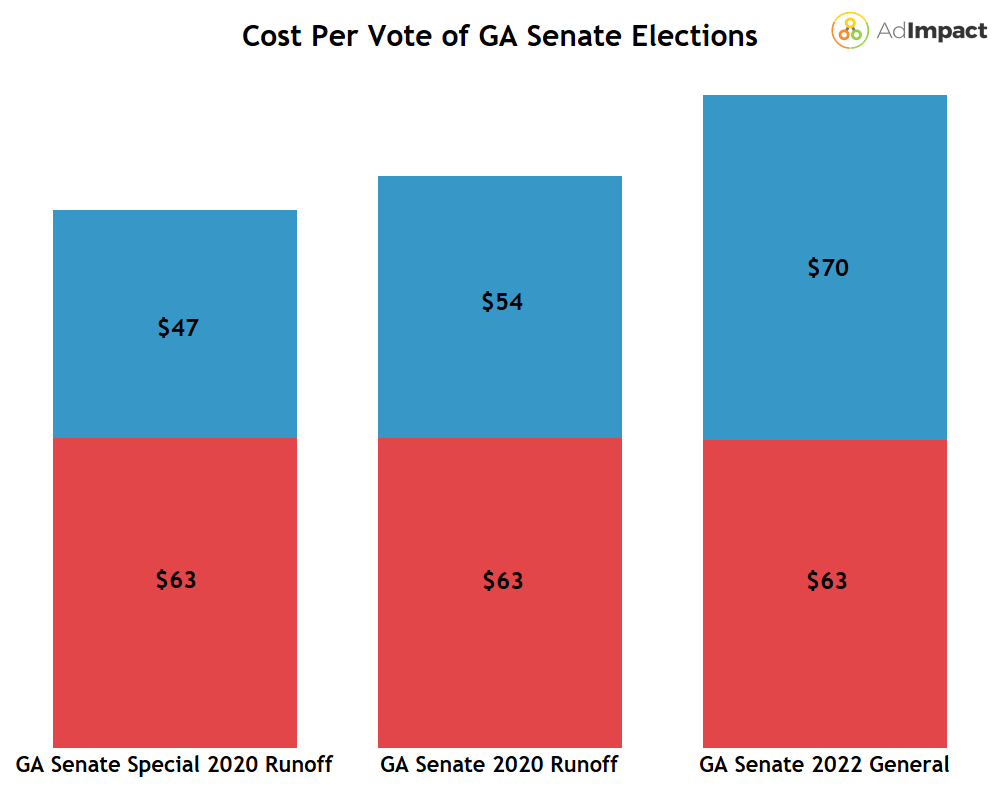
GA Senate elections have been the home to some of the most expensive elections of all-time: Both 2020 runoffs and the 2022 general make up three of the top four most expensive non-Presidential or issue elections ever (NC’s 2020 Senate general saw about $100K more than the GA Senate Special 2020 general runoff). By CPV, Republicans has a similar cost per vote across these three high-profile Georgia elections, while Democrats dramatically increased their cost from 2020 to the 2022 general.
Across all 2022 Senate general elections, Democrats had a higher cost per vote than Republicans. Democrats spent $20.17 per vote in Senate general elections, compared Republicans spending $17.41. To give overall context of those numbers, Democrats spent $790M on 39,306,212 Senate votes and Republicans spent $690M on 39,627,602 Senate votes. Those appear to be similar, but the breakout by advertiser type shows a stark difference.
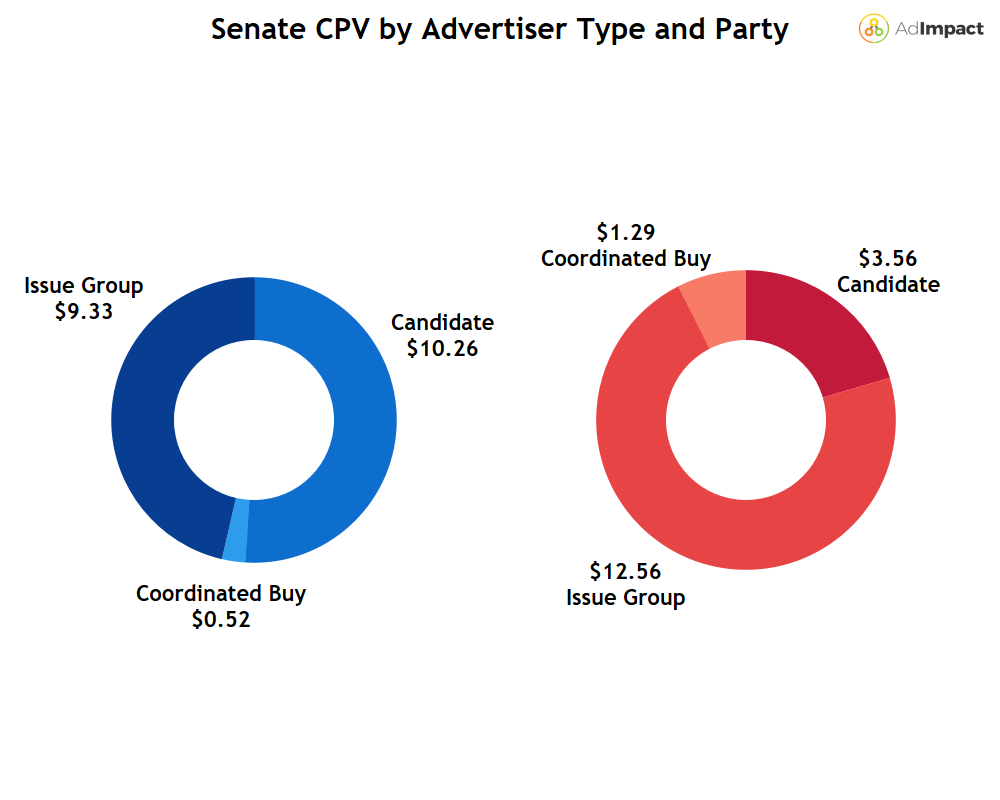
Republican issue groups spent the most per vote in Senate elections, topping both Democratic candidates and issue groups. Democratic candidates had the second highest CPV overall, but they had the most broadcast airings in Senate elections. With 363K total airings, they vastly outnumbered ads from Republican issue groups, who only had 210K total airings. Due to better rates for candidates than groups, Democratic candidates could air more ads despite spending $94M less than GOP groups.
By Cook Political Report Race rating, the Senate CPV appears on a bell curve, essentially meaning that more competitive elections saw higher CPV figures or more “expensive” votes.
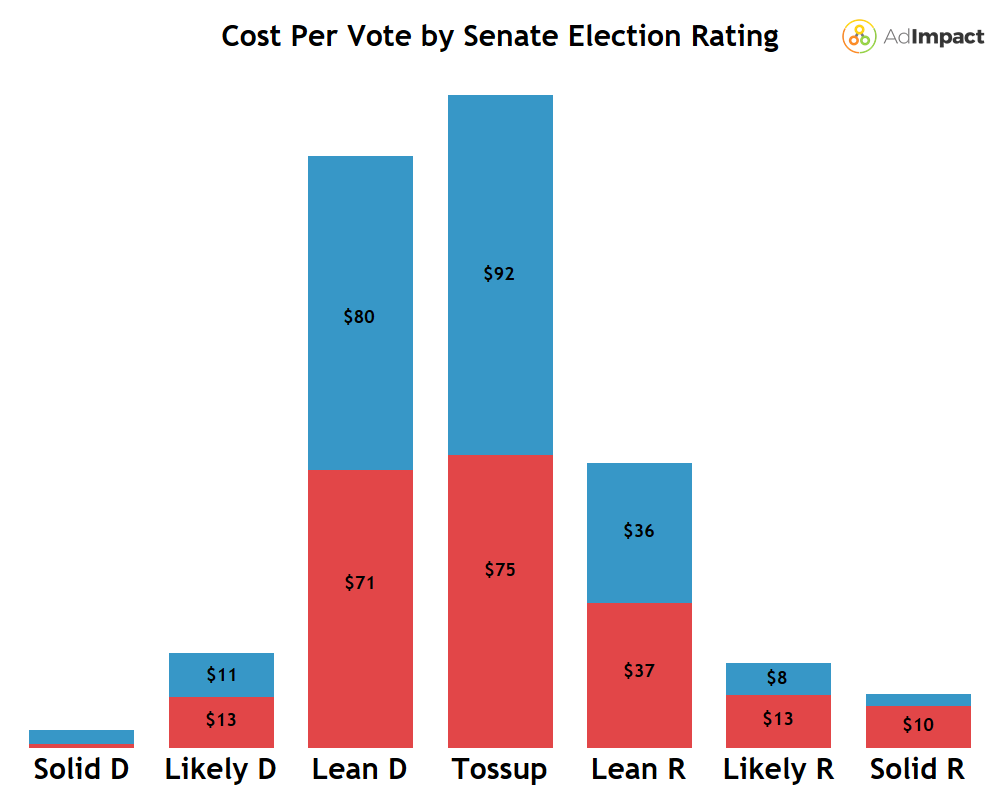
Democrats spent around $17 more per vote in Senate tossup elections than Republicans, adding up to a $87M advantage. The Democratic candidate won in all four of the tossup elections (AZ, GA, NV, and PA).
House Cost Per Vote
In the House, there was one race that stood out from the others from a CPV perspective. CA CD-22 saw a $300+ CPV from both parties, while no other Congressional or gubernatorial election recorded a $200+ CPV. On the Democratic side, both the DCCC and House Majority PAC spent at least $5M in this election, in addition to $1.9M from candidate Rudy Salas and a $1.3M DCCC/Salas coordinated buy. Meanwhile, the NRCC spent $7.4M and Congressional Leadership Fund spent $6.4M. Incumbent David Valadao spent $2M.
In House elections where both parties placed ad reservations, there was an average of 260K total votes cast. CA CD-22 had the fewest number of votes out of any of these elections, at just above 100K. Yet, CA CD-22 was the third most expensive House election of the cycle. Valadao (R) won the district by three points.
California hosted three of the top five House races with the most significant difference in party CPV for tossup, Lean D, or Lean R elections. NV CD-04 had the largest difference, with a $68.56 Democrat advantage. Of the top five, CA CD-27 was the only House general with a Republican CPV advantage.
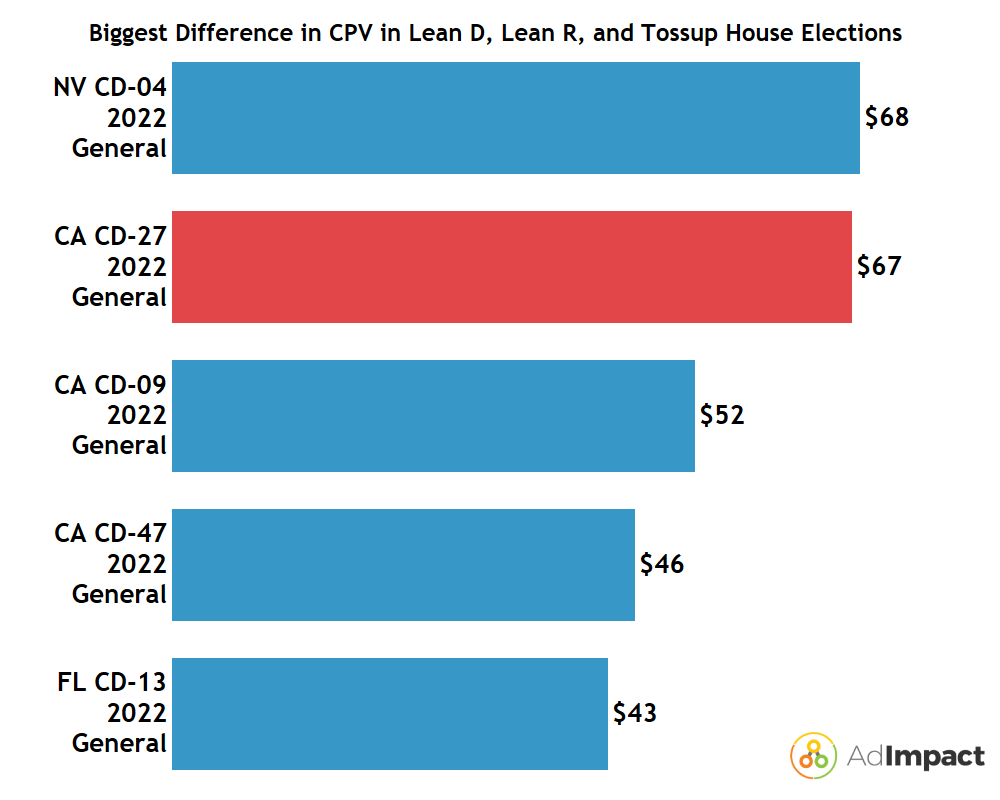
Of those five elections, Democrats won three and Republicans won two. In CA CD-27, Mike Garcia (R) prevailed over Christy Smith (D). Republicans spent $8.3M in this election, compared to just $1.1M from Democratic advertisers. In FL CD-13, which had a large Democratic advantage in cost per vote, the Republican candidate Anna Paulina Luna won the election. The race was rated as Lean R.
In House elections, the CPV by Cook Political race rating is normally distributed and appears to be a bell curve.
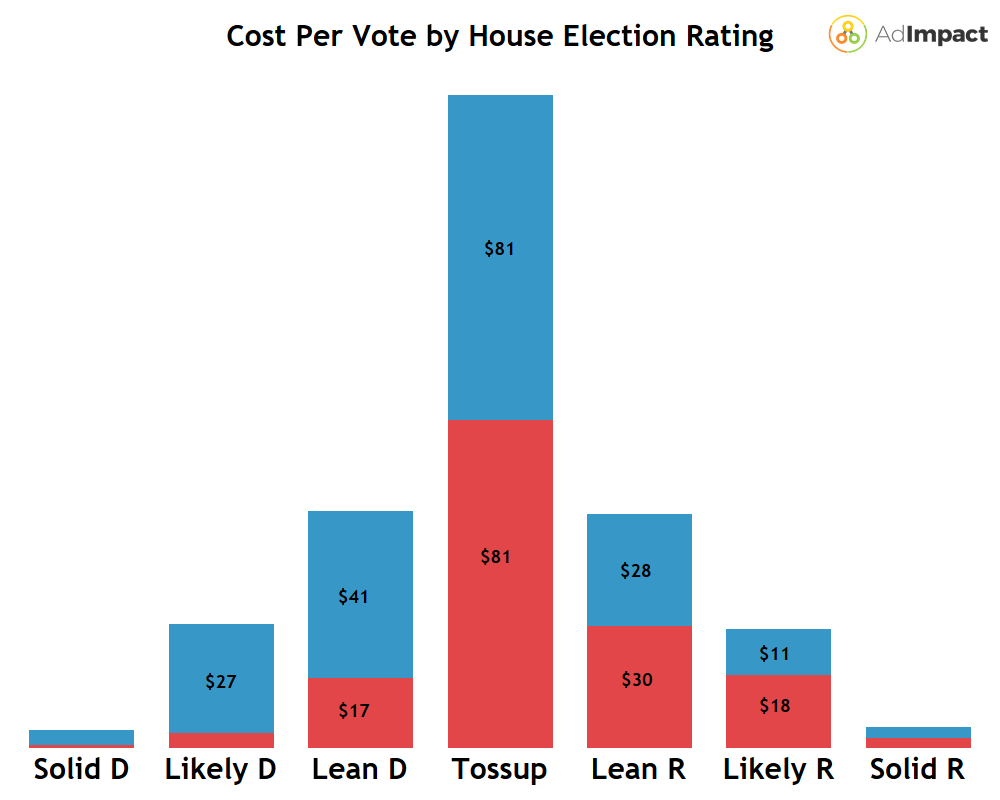
Tossup elections had the highest CPV for both parties. Democrats did spend more across the board than Republicans, but most interestingly, they were defensive with their spending in safer districts. Democrats’ $27 CPV and $41 CPV in Likely D and Lean D, respectively, shows how their ads were dominant in elections that were considerably safer. Republicans did not spend as much in their safer districts, but were basically equal in CPV in tossup elections.
Gubernatorial Cost Per Vote
Across the 33 gubernatorial elections in the 2022 Midterms, Nevada was the most expensive gubernatorial election by CPV. A competitive race between incumbent Steve Sisolak (D) and Joe Lombardo (R), combined with the state’s sparsely populated markets of Las Vegas and Reno gave it a higher CPV compared to other states.
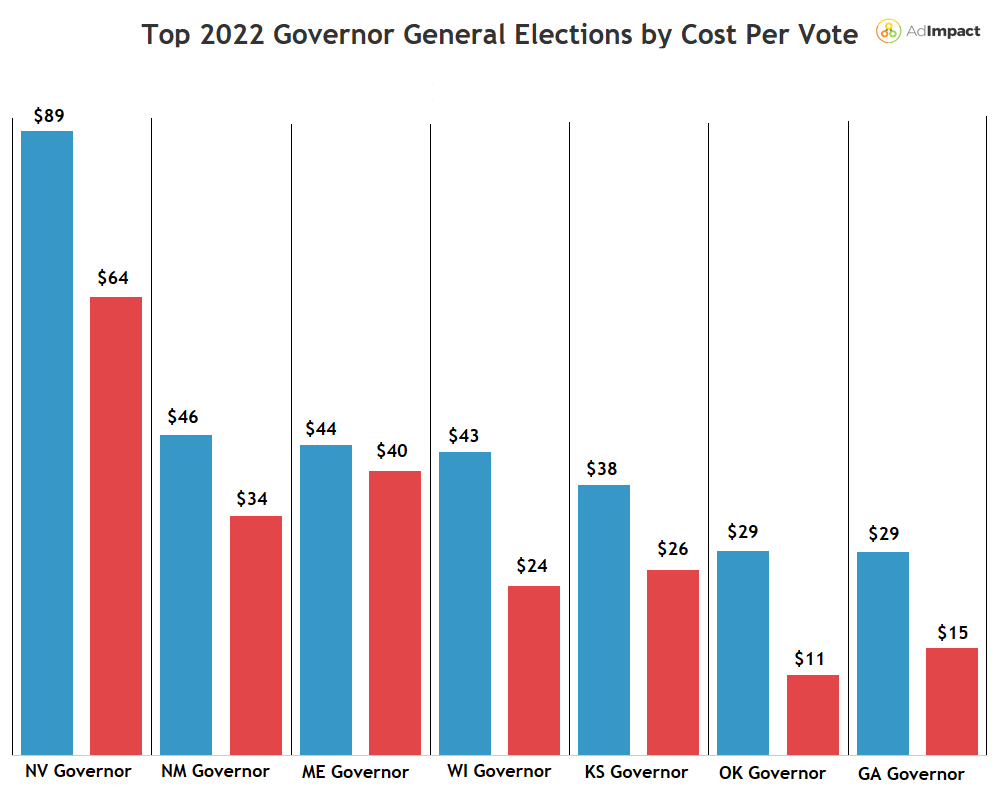
Across all gubernatorial elections, Democrats had a total CPV of $13.46, and Republicans had $10.28. While Democrats lost the gubernatorial general in Nevada, they did win in New Mexico, Maine, Wisconsin, and Kansas. Adding up spending across all of 2022's gubernatorial elections, Democrats held a $582M to $436M spending advantage over Republicans, contributing to Democrats having a higher overall cost per vote than Republicans.
Interestingly, the sixth most expensive gubernatorial election by CPV was Oklahoma’s general election. Once considered a Safe R race, Oklahoma's gubernatorial general election saw a surprising amount of total spending at $21M. Advertisers spent $10M in the Oklahoma City market (44th largest DMA) and $8.8M in Tulsa (61st). Democrats had a $29 CPV, with 16,000 airings, more than the Republicans’ $11 CPV and 7,500 airings. The Republican, Kevin Stitt, defeated Democrat Joy Hofmeister 55.4% to 41.8%.
Two notable elections with low CPVs were 2022’s two most expensive gubernatorial general elections: Texas and Florida. Their exclusion is due to the states’ high populations and vote turnouts, driving the overall cost per vote down.
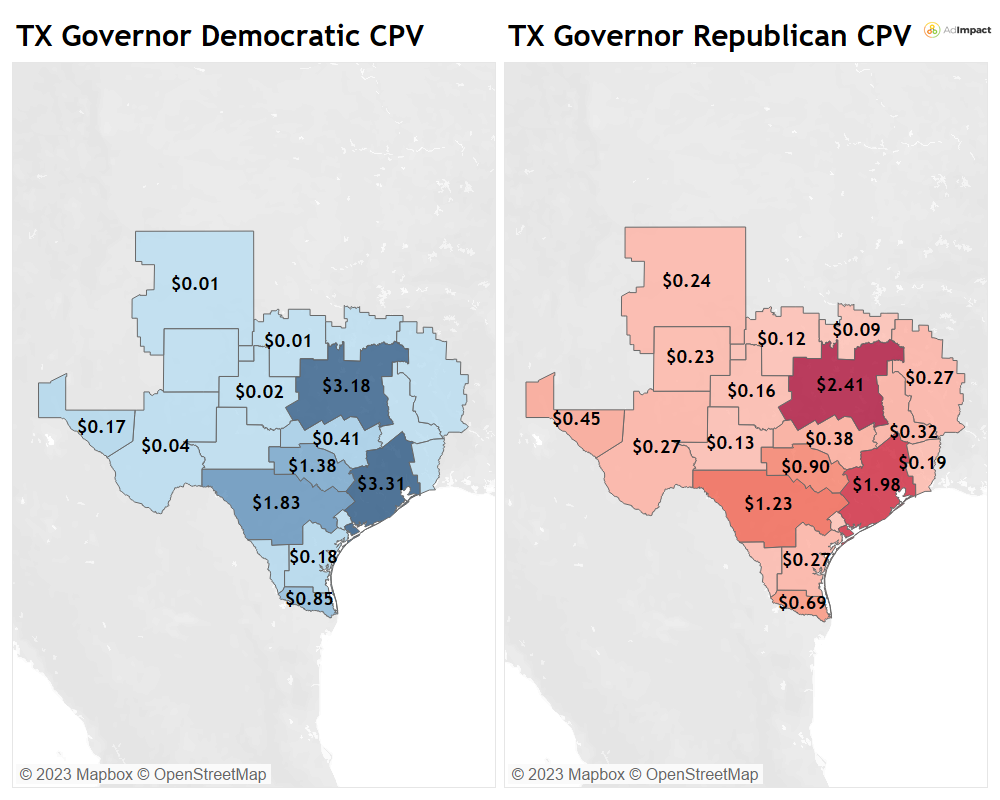
By analyzing the CPV broken down by market in Texas, the rural and urban divide between Democratic and Republican voting bases become clear. Democrats had a higher CPV than Republicans in urban Texas broadcast markets (Dallas, Houston, and San Antonio). Republicans had a higher CPV in rural areas across the state, even spending in markets Democrats avoided in the gubernatorial election.
Oregon’s gubernatorial general was the only gubernatorial election this cycle that saw significant spending from an independent candidate. Betsy Johnson spent $12M, making up 23% of the race’s $53M total expenditure. Johnson had a CPV of $59 while Democratic advertisers had $19 and Republicans had $18. Johnson only had 20,500 airings, compared to Democrats’ 35,750 and Republicans’ 24,500 airings. She only received 8.6% of the vote.
Looking at the CPV by Cook Political rating for gubernatorial elections, they also resemble a bell curve similar to the likes of House and Senate elections.

State Breakdown
Across all House, Senate, and gubernatorial elections, the top ten states by CPV were as follows:
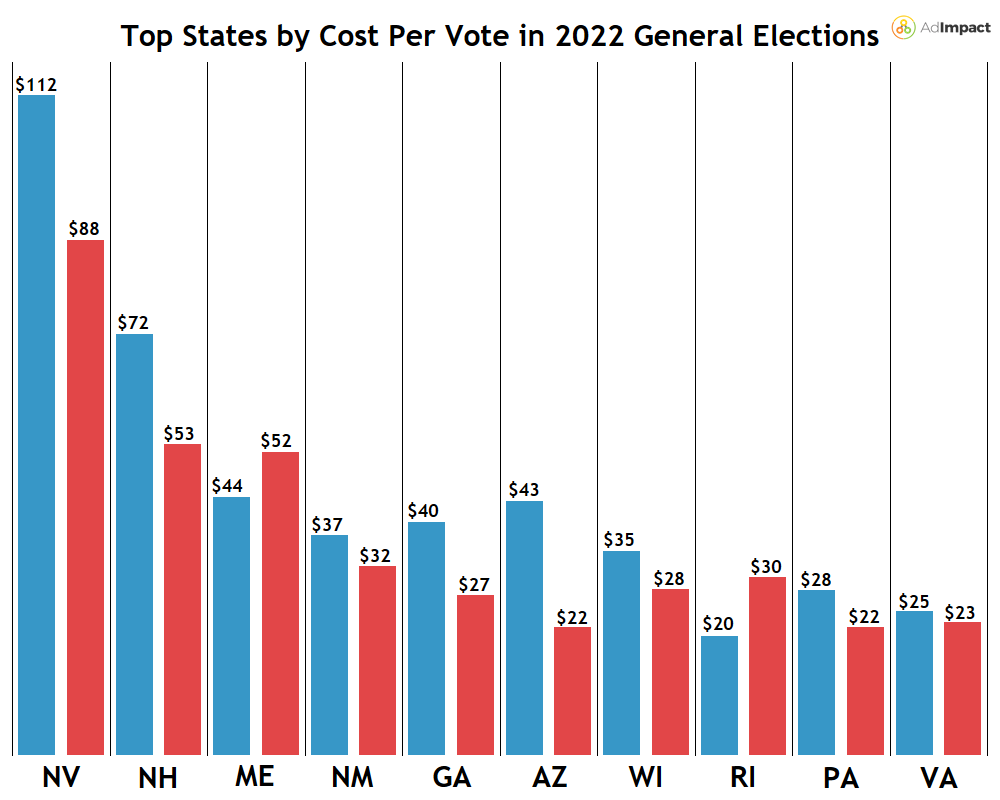
Typically, states with smaller media markets with smaller populations hosting competitive elections had higher CPV totals. Democratic advertisers held a higher CPV in eight of the top ten states by total CPV. Republican advertisers only had a higher CPV than Democrats in Maine and Rhode Island. In the top ten states, the average Democratic CPV was $45.60 while the average Republican CPV was $37.70.
For AdImpact's analysis on the proposed changes to the Democratic Presidential primary schedule, read our recently published blog offering a market level analysis on the schedule changes.