Written by Nate Schwartz
A week before the general election in November, AdImpact conducted a toss-up elections analysis looking at candidate and issue group spending. The big takeaway from this analysis is that Democratic candidates outspent Republican candidates, while Republican issue groups outspent Democratic issue groups. Even with the differences between advertiser types, the partisan spending difference across all of these toss-up elections was almost equal. The original post can be read here.
There were 33 toss-up elections at the time of the original toss-up elections analysis and those elections will be used in this post for consistency’s sake. The “toss-up” classification fluctuated throughout the election cycle, so there are other elections that also were considered toss-ups at one point or another during the cycle.
In these 33 toss-up elections, Democrats won 23 and Republicans won ten. The Democrats' success in these toss-up elections was key to them preventing a red wave in the House. Candidate and issue group spending will be split up based on each election’s result. The totals below reflect both the Democratic and Republican spending advantages by advertiser type. Coordinated buys have been excluded as only four of the elections saw significant coordinated buys. The original post briefly explains each of these.
Elections Where Democrats Won:
Elections Where Republicans Won:
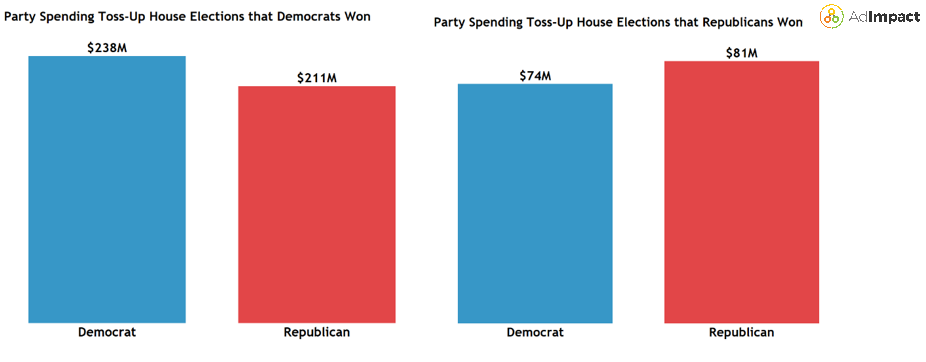
Overall, elections that Democrats won saw more spending from Democratic advertisers, while elections that Republicans won saw more spending from Republican advertisers. While this is a somewhat straightforward and expected result, the spending differences were close between each party.
In elections where Democrats won, they made up 53% of the total spending, spending $238M out of $449M total. In elections where Republicans won, Republicans also made up 53% of the total spending, but it was $81M out of $155M total.
The divide between issue group spending and candidate spending is unusual. Ads by candidates are important because the campaign gets to control all of the messaging that it shows. Issue groups, on the other hand, are not supposed to communicate with the campaigns, so the messaging cannot entirely be monitored. Additionally, issue groups face more expensive rates for ad purchases than candidates do.
In elections won by Democrats and Republicans, Democrat candidates typically held the spending advantage over Republican candidates. The Democratic candidate made up 68% of the candidate spend in elections they won and they made up 69% of the candidate spend in elections they lost.
Republican issue group spending advantages had an interesting disparity between the elections Republicans both won and lost. In winning toss-up elections, Republican issue groups made up 10% more of the total issue group spend than in elections they lost. Essentially, the toss-up elections that Republicans won had more issue group spending on average than elections they lost.
Within the 33 elections examined in this toss-up elections analysis, $458M was spent by issue groups, their messaging has a significant impact on all of the elections in which they are involved. Candidates’ ad buys are critical, but issue groups continue to have a massive effect on close elections.