Written by Nate Schwartz
According to The Cook Political Report, the 2022 midterm election has 33 toss-up elections for Congressional seats as of 10/28. These elections, which Cook believes can fall to either party, are one of the main focal points of this election season. These races have seen high amounts of political spending as both parties feel like they can gain the advantage in all of these districts. However, the spending landscape in each of these districts varies greatly. It goes without saying that each election has its own unique characteristics between relevant issues and the candidates who are running, but all of these elections can be considered equal in terms of which party will have the majority in the House of Representatives come November.
In order to see how these elections are shaping up by spending, we’ll look at each parties’ respective political spending advantage or disadvantage by advertiser type. This can help show if candidates are reliant on issue groups to gain an advantage in spending against their opponent.
To do this, we split the spending between candidate and issue group, excluding coordinated buys, and then looked at the percentage of either the Democratic or Republican spending advantage. Overall, here’s how the spending landscape looks across all thirty three toss-up districts.

This graph shows that Democratic candidates have made up 70.8% of the total spend and 29.2% more than Republican candidates in these toss-up districts. However, Republican issue groups have made up 55% of the issue group spending, which is 10% more than Democratic issue groups.
Even though Democrats have a large advantage in candidate spending in these toss-up districts, it is significantly less money than issue group spending. In all 33 toss-up elections, candidates from both parties have spent a combined $107M compared to $385M from issue groups. The Democratic advantage in candidate spending is mitigated by the Republicans’ advantage in issue group spending, where overall spending in these elections actually gives an advantage in overall spend to Republicans. Across all 33 elections, and including all media types Republicans have spent $241M compared to Democrats’ $252M, which is just a 1% difference. Through all of the chaos of the election cycle, the spending on toss-up house races are within reach of each other. Both parties have gone through different paths to reach almost equal amounts.
Looking at the difference in percentage of advertiser type spending, there’s a 27% difference between Democratic candidate and issue group spending, which also means there’s a -27% difference between Republican candidate and issue group spending. Essentially, Democrats are using candidate spending to make up for their issue group spending disadvantage, while Republicans are using their issue group spending to mitigate their candidate spending disadvantage.
While the two parties are almost identical in total spending, looking at a more granular level tells a slightly different story.
Republicans hold a political spending advantage in sixteen of the thirty-three elections, or 48%. Democrats do hold stronger political spending advantages in the elections that they spend more in, hence why the total spending is very similar.
There are only four elections that have a shift of $1M or more when coordinated buys are included: CO CD-08, IN CD-01, MN CD-02, and NV CD-01.
Going back to the difference between spending in advertiser type, the toss-up elections show a variety of different trends.
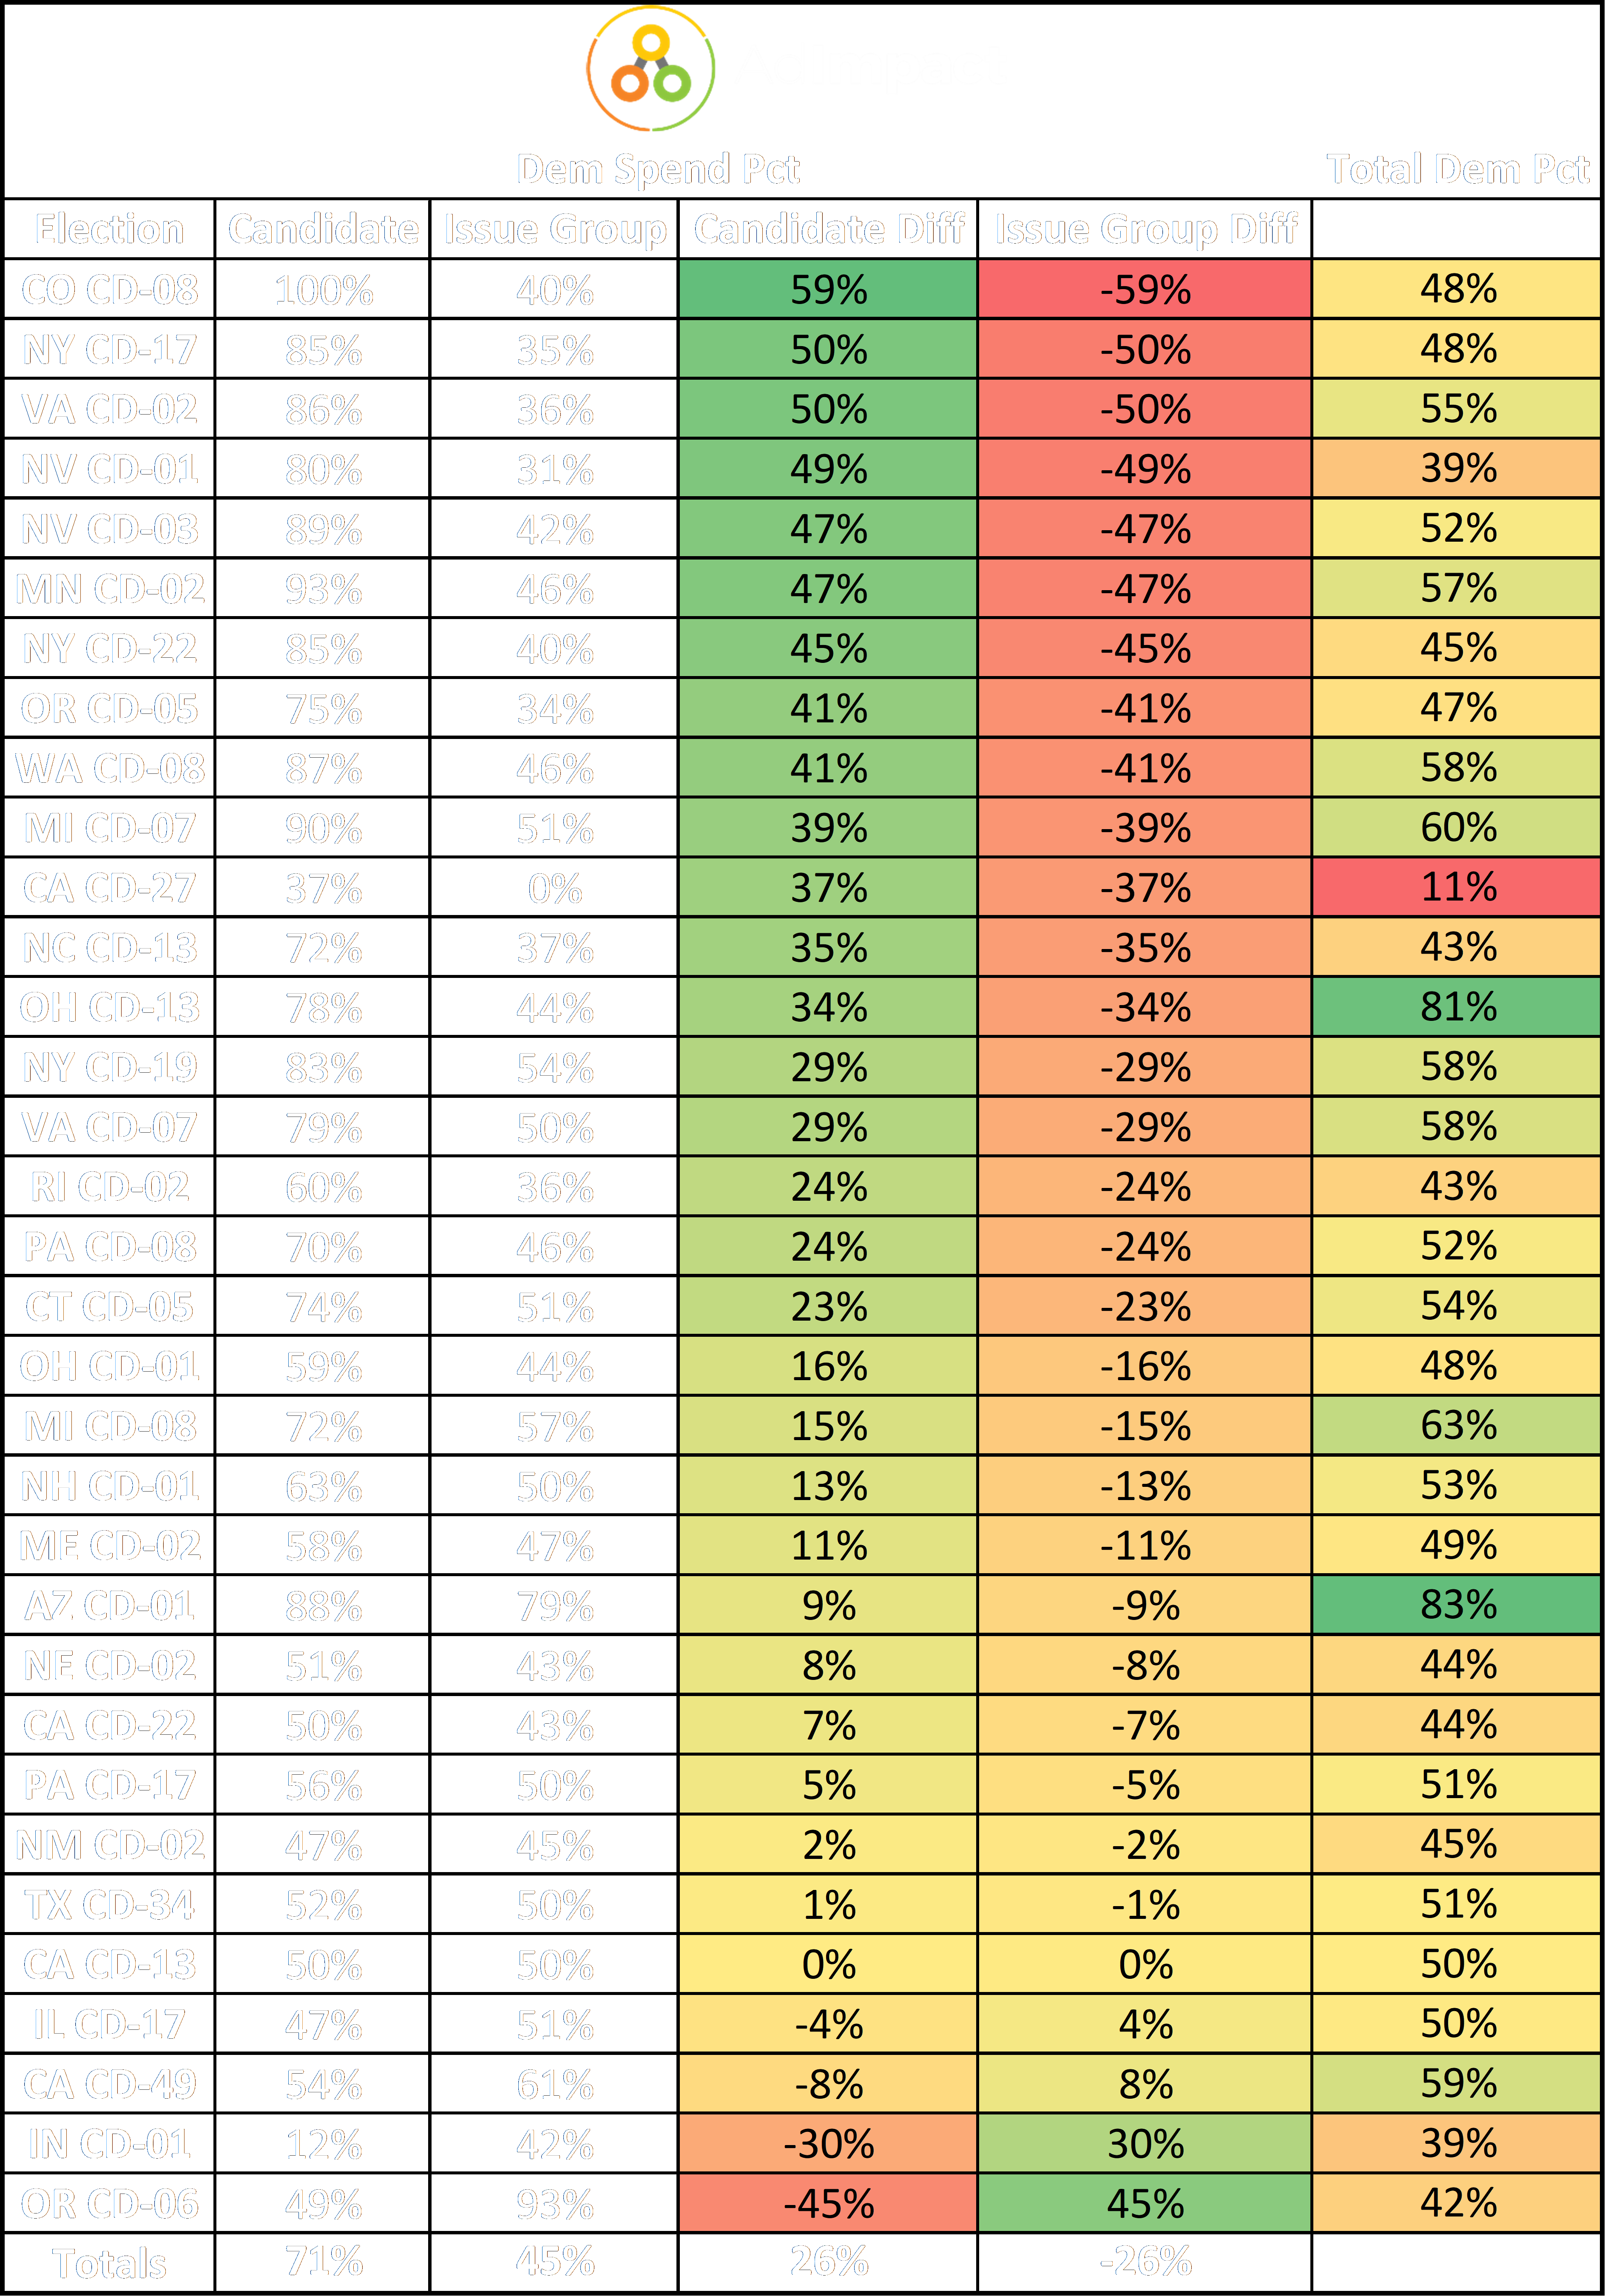
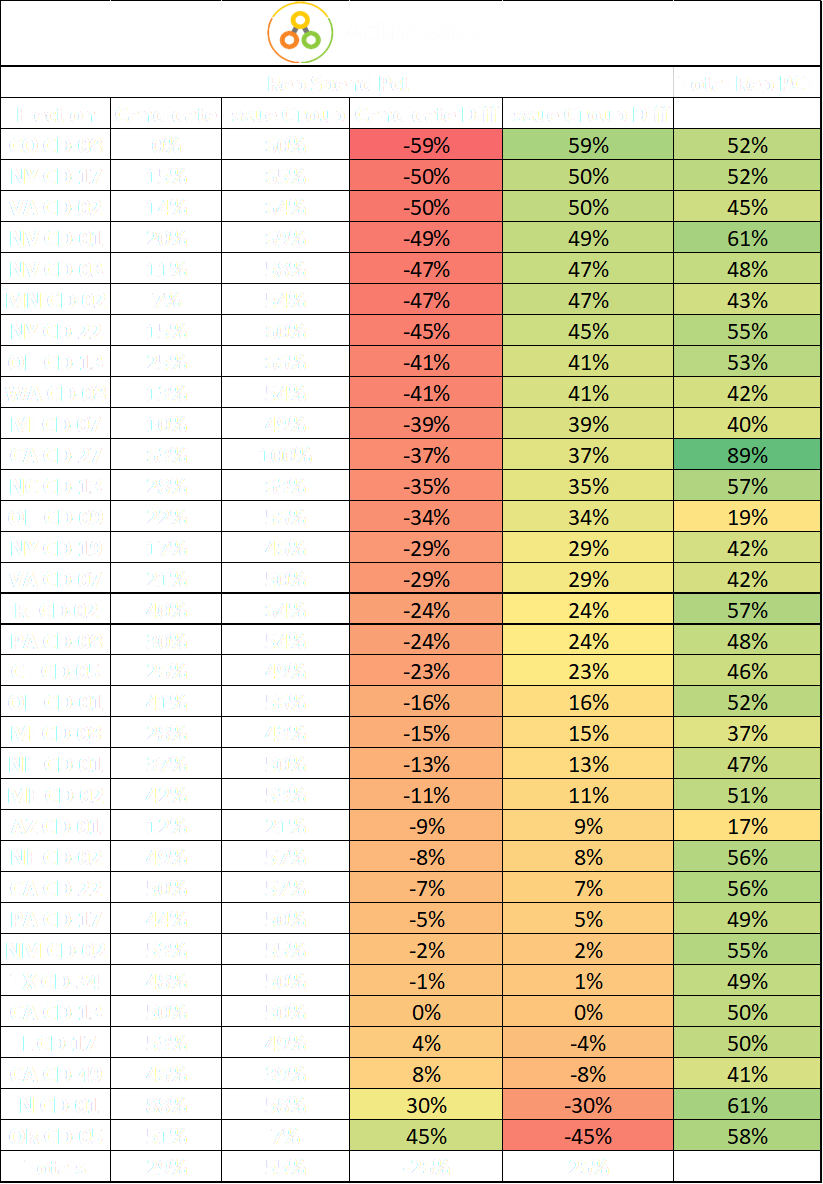
The first chart has the percentage of Democratic spending for both candidates and issue groups, and then the difference between the two both in favor of candidate spending and issue group spending. The second chart has the Republican spending for both advertiser types and their differences are displayed. Between the Republican and Democratic sides, they are inverses of each other and simply another way to look at the data. For the candidate difference column, the higher the percentage the more candidate spending advantage makes up for an issue group disadvantage. For the issue group difference column, the higher the percentage, the more issue group spending advantage makes up for a candidate disadvantage.
To understand the candidate and issue group differences, we’ll use the Democratic candidate difference to explain. If the Democratic candidate difference is closer to 100%, the Democratic candidate has a spending advantage that makes up for a deficiency in issue group spending (or it’s simply not as much of a difference). The closer the Democratic candidate difference is to -100%, the more issue groups are spending to make up for a lack of candidate spending. These differences are inverted for issue group spending difference and Republican candidate spending difference, while matching the Republican issue group spending difference.
The biggest takeaway is that Democratic candidates consistently outspend Republican candidates, while the flip side is that Republican issue groups consistently outspend Democratic issue groups. There are only four elections where that is not true: CA CD-49, IL CD-17, IN CD-01 and OR CD-06. Interestingly, CA CD-13 is a zero percent difference, meaning the candidate and issue group spending is basically identical. OR CD-06 and IN CD-01 have significant coordinated buys that alter the data. In OR CD-06, there’s a coordinated buy between the NRCC and Erickson for $1.4M; and in IN CD-01, Mrvan has a $1.3M coordinated buy with the DCCC. In the election with the biggest difference, CO CD-08, Barbara Kirkmeyer’s $1.6M of ads have also all been a coordinated buys.
While there is something unique about all of the spending in these elections, we will only highlight a few of the most interesting races:
VA CD-02, which has a 50% difference between the candidate and issue group spending, is seeing similar values between their highest spenders, while others are lagging behind. The strong amount of spending from Luria (D) create this disparity, while the total team spending is near identical. Total spending for VA CD-02 from both parties has reached $16M.

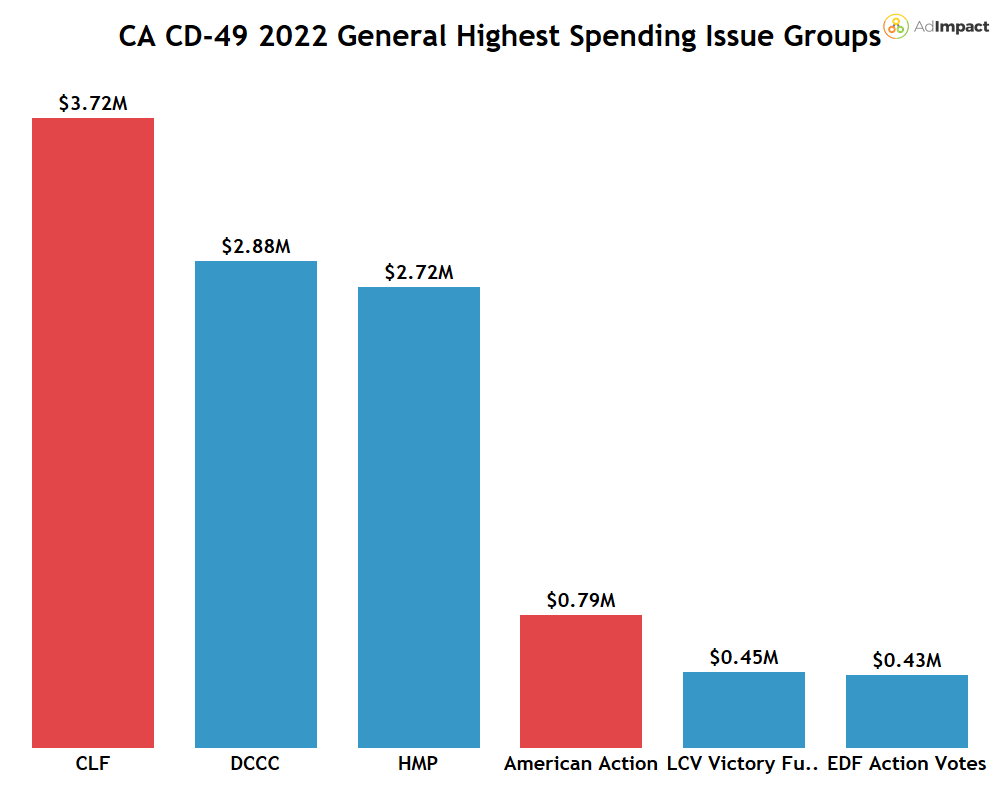
In CA CD-49, Democrats have outspent Republicans by $2.3M with Democrats spending $8.9M and Republicans spending $6.6M. There’s a -8% difference between candidate and issue group spending, favoring Democratic issue groups, which is a unique case. The DCCC and House Majority PAC have spent considerably in this election, while the spending between the two candidates have been similar. Mike Levin (D) has spent $2.4M to Brian Marycott’s (R) $2.0M, but the issue group difference is stark.
Lastly, CA CD-27 is unusual as it’s the only election without a parties’ issue groups spending a significant amount of money. The Republican incumbent, Mike Garcia, is being challenged by Democrat Christy Smith. Garcia has the full backing from issue groups, while Smith does not. There are two issue Democratic issue groups who have spent in this election, but they have spent a combined $2K total.
Overall, there are a lot of familiar faces across all of these. Namely, the CLF, HMP, NRCC, and DCCC have spent a combined $346M out of the total $386M spent by issue groups in these toss-up elections. The two Republican groups have spent $193M while the two Democrat groups have spent $152M. As the election cycle has progressed, HMP and NRCC have spent similarly. CLF has spent the most of the four, with a strong start early in general election season.

These elections have seen a vast amount of money as they have the power to sway Congress in either parties’ direction come November 8th. Republican issues groups have been the leading group across all forms of media, but Democratic candidates help bridge the gap to even the spending between the two parties. Candidates and issue groups continue to add money to these races, even if they have purchased ads up until election day, as the power of their party might depend on it.