Introducing 2022 Spending Projections
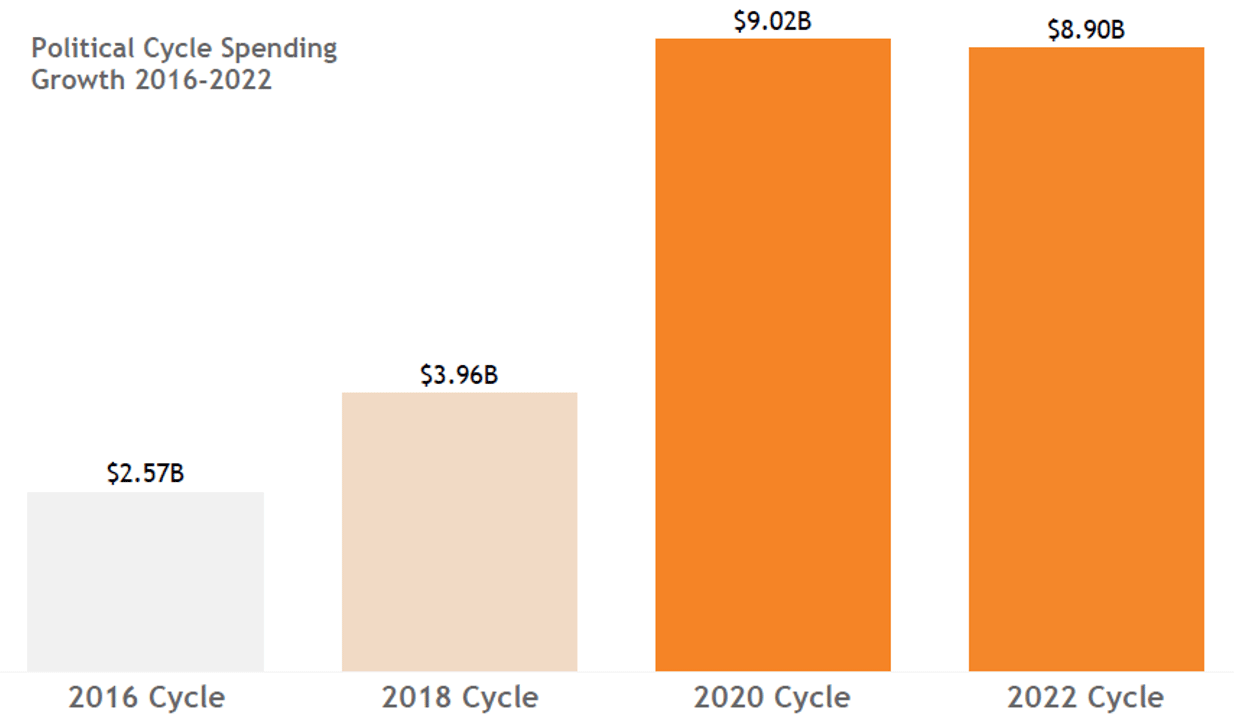
In the 2019-2020 election cycle, we saw a 244% growth in media spending vs. the comparable 2015-2016 cycle. Spending was driven in part by a highly competitive Democratic presidential primary (with two self-financed billionaires) and a fierce general election. Additionally, competitions other than the presidential race, reached historic heights as we saw 9 of the 10 most expensive senate races occur this past cycle.
Amid speculation that Covid-19 would impact campaign fundraising and electoral turnout, 2019-2020 was the most costly election cycle in history. By the time the last vote was counted, the numbers blew past even the most dramatic forecast. Massive increases in political expenditures show no sign of abating in 2021-2022, given that the underlying forces that create such impressive levels of spending haven’t fundamentally changed.

Based on our projections, we expect the 2021-2022 cycle to reach spending totals of $9B again, even without a presidential election at the top of the ticket.
Background on the 2022 Cycle
2022 will be a competitive election year. There are gubernatorial races in 36 states, and the Democrats’ razor thin margins in the House and Senate mean that every seat has the potential to flip control of both chambers. As competitive races up and down the ballot begin to prepare and execute ad campaigns, digital fundraising will continue to play a pivotal role in helping candidates collect cash to spend throughout the election. And if our forecast proves correct, that spending will rival 2020 in hopes of giving either party a better chance of winning on election day.
The 2022 figure is impressive and a little surprising based on the conventional wisdom that, if held, would assume more subdued electoral activity this year. Pundits and others have made these predictions following the departure of President Trump from public life, he was, after all, one of Democrats’ biggest fundraising assets, and given that there’s no presidential election on the ticket. But so far this cycle, the data we’re seeing shows a major increase in spending activity over past cycles.
Political Media Activity Data
Our forecasted 2021-2022 figure is impressive but is grounded in historical data. Our analysis shows that political media activity in Q2 of 2021 was 107% higher than Q2 of 2019, which is surprising given that the 2020 cycle had a presidential race. Also of note, the increased activity is coming from a wide variety of advertisers across the country, indicating it is not just one active group driving spending. Historical trends indicate that spending generally grows quarter-by-quarter over a two-year cycle. If we hold true to this current trend, even the most bullish forecast could potentially undersell spending levels for the coming elections.
What is driving this explosive growth? In recent years, we’ve seen the widespread use of Facebook as a fundraising tool to allow campaigns to quickly and easily reach a highly polarized electorate. This, combined with the rise of easy online donation tools such as ActBlue and WinRed, has let candidates and issue groups fundraise with greater ease than ever before.
With more cash on hand, candidates have the flexibility to spend earlier compared to past cycles, utilize expanded platforms, and generally deploy these cash reserves with greater breadth and precision. In tandem with the growth in social media and the continued polarization of the electorate, we’ve also seen the election cycle lengthen. In recent years, many electoral competitions start more than a year out from election day, from presidential to down ballot races.
The 2022 Media Landscape
Electoral spending data from Facebook and Google was certainly the main story last cycle. These platforms continue to be critical to modern campaigns in both fundraising and get out the vote efforts. But this election cycle, we are paying close attention to an emerging, increasingly important space. As the American electorate diversifies its screen consumption habits, we’re seeing huge growth in political spending on Connected TV. Consequently, we, in collaboration with CrossScreen Media, are excited to forecast CTV expenditures for the first time. Our political projections expect them to reach $1.5B, out of a total of the $9B anticipated.
But that isn’t to discount the importance of traditional media in a given election. As with past cycles, we expect broadcast to capture the lion’s share of spending this cycle. Even though candidates now have a wide array of options for reaching voters, we still see candidates consistently turning to broadcast tv in the final months of an election. These persuasion-style ads are blasted across relevant markets, and often provide candidates with a good amount of earned media as well. Broadcast ads from last year’s presidential race regularly featured on late-night shows and primetime news, providing additional reach and frequency for campaigns.
What is driving this explosive growth? In recent years, we’ve seen the widespread use of Facebook as a fundraising tool to allow campaigns to quickly and easily reach a highly polarized electorate. This, combined with the rise of easy online donation tools such as ActBlue and WinRed, has let candidates and issue groups fundraise with greater ease than ever before.
With more cash on hand, candidates have the flexibility to spend earlier compared to past cycles, utilize expanded platforms, and generally deploy these cash reserves with greater breadth and precision. In tandem with the growth in social media and the continued polarization of the electorate, we’ve also seen the election cycle lengthen. In recent years, many electoral competitions start more than a year out from election day, from presidential to down ballot races.
What Does This Mean for Voters?
Most obviously, it means a near-constant flow of persuasion-style electoral ads in competitive areas. While these projections don’t forecast the number of election-related ads in 2021-2022, we do have historical data to provide some context. In the 2020 cycle, we tracked over 9 million airings of 14,000 unique political tv ads across the country (31% percent of these ad airings were related to the presidential race). Voters in Phoenix, AZ saw the most tv ads of the cycle with 184,000 total airings.
Even without a presidential race, competitive Senate, House, and Gubernatorial elections in Florida, California, Georgia, Pennsylvania, Arizona, will mean that voters should expect a high volume of broadcast ads (and ads via radio, smart tv, and social media, etc.), particularly closer to election day.
Electoral Spending Trends to Look for in 2022
Where does all this spending come from? Last cycle, 51% of spending came from special interest groups, and 49% came from candidates. In fact, California saw the most spending of any state because of the high volume of ballot propositions on the ticket. In some cases, issue groups advertising in favor of a candidate or an initiative outspend candidates by as much as $170 million, like in the 2020 race for NC Senate. These groups also pay much higher rates than candidates, requiring them to dole out more cash. We also see issue groups benefitting from small-dollar donors in addition to anonymous mega-donors.
Don’t Discount the Candidates
When federal elections get competitive, and both bases are energized, it has become normal to see candidates spend tens of millions to increase the chance of winning. Jaime Harrison set records last year as the highest spending candidate of all time (excluding the Georgia runoff races) when he spent $85 million in his attempt to oust Lindsay Graham in the SC Senate Election.
Runoffs like the two for Georgia Senate also play a huge role in the amount of candidate spending especially if they could again decide which party controls the chamber. We saw 18% of total senate spending take place in the Georgia runoffs, with Senator Warnock’s seat up for election again in 2022, there is a possibility for another round of runoffs in Georgia that could be as contentious as the last.
We have based our 2022 forecast for the House on competitive, high-spending seats from previous years. But it’s important to note that that could change based on redistricting. We will be watching the outcome of redistricting closely in order to better project electoral spending for the House.
How We Determine Our Projections
We set out to build our political projections from the ground up. Rather than dividing the topline numbers from previous years, we built a model to forecast spending at the individual race level and then rolled these numbers up to reach our topline conclusions about electoral spending. Spending levels in a race correlate strongly with the competitiveness of a seat, so we based our 2022 estimates on each seat’s previous election spending levels and Cook Political Report’s race ratings (Lean D, Toss Up, Lean R etc.).
Historic spending levels come from our comprehensive database of political media expenditures. This baseline number is then adjusted by factors such as the price of a media market and candidate cash-on-hand reports. On average, a race in a historically expensive, cost per spot (CPS) market like Los Angeles, CA will see far more spending than a race in a lower CPS market, such as Norfolk, VA, since it costs significantly more to reach the same relative audience levels.
These political projections will also likely adapt as the electoral landscape changes. Unexpected retirements, strong fundraising, redistricting, and unforeseen, galvanizing issues can, and will, cause the election landscape to shift. We will periodically update our forecast, but these initial projections can be considered a baseline for how things look at this moment in time. And, as always, it’s important to note that higher spending does not always correlate with the chance of winning the vote.
About AdImpact
AdImpact (fka Advertising Analytics) provides media companies, agencies, platforms, data, and martech companies alike with ad intelligence insights that facilitate enhanced attribution, research, and other media and marketing outcomes.
AdImpact collects, analyzes, and reports on over one million TV ad occurrences daily in real-time, involving over 41,000 brands and advertisers. Coverage includes all national broadcast TV networks, 1,100 local broadcasters, and over 80 cable TV networks across all 210 U.S. DMAs. In addition to linear television, AdImpact tracks digital media advertising including over 24,000 digital advertisers and over 12,500 publishers. By Q3 2021, AdImpact looks to introduce CTV/OTT/addressable TV ad occurrence coverage, creating a 360-degree view of the hyperdynamic TV ad intelligence universe.
Through innovation, AdImpact provides effective real-time delivery of advertising occurrence data, so we can report on an ad being shown within 5 minutes of it appearing on TV. That’s something none of our competitors can offer.
In the political sphere, AdImpact collects electoral ad spending and occurrences from the federal to the local level, leveraging the data to create user-friendly analytics for clients. AdImpact also collects rate-level data to provide deep insights and build rate forecasts to help buyers and media companies alike. AdImpact’s political data is trusted by a full spectrum of political experts, from presidential campaigns to top-tier news outlets.


.png)


